Eliminating AI biases in Fintech & Banking

In this paper we will cover factors contributing to AI biases, best practices when engineering fair and responsible models, and VALID’s own monitoring study demonstrating model risk performance across income and demographic data.
In recent years, the banking and financial sectors have undergone a significant transformation with the integration of Artificial Intelligence (AI) and machine learning technologies. These innovations have revolutionized various aspects of the industry, from customer service and fraud detection to credit assessment and risk management. However, amid the promises of efficiency and accuracy, a shadowy concern has emerged – the existence of AI biases.
AI biases refer to the skewed or unfair decisions made by AI algorithms, resulting in unequal treatment of certain individuals or groups. These biases can stem from the data used to train these algorithms, reflecting historical prejudices and discriminatory practices. The banking industry is not immune to these biases, and understanding their nature is crucial for fostering transparency, accountability, and fairness. At Valid we strive for fairness in any banking decision AI model that we build. In this paper we will cover factors contributing to AI biases, best practices when engineering fair and responsible models, and VALID’s own monitoring study demonstrating model risk performance across income and demographic data.
The Nature of AI Biases in Banking and Finance
AI systems in finance are often trained on historical data that contains a plethora of information about past borrowers and their payment behavior. However, this data can inadvertently embed societal biases, such as racial, gender, and socioeconomic disparities. When these biases are not identified and corrected, AI algorithms perpetuate these inequities, leading to biased banking decisions.
One common example is the racial bias found in lending algorithms. Studies have shown that AI-driven lending models may disproportionately deny loans or offer less favorable terms to individuals from marginalized racial and ethnic backgrounds, even when controlling for other relevant factors like creditworthiness. This can further widen existing wealth gaps and inhibit economic mobility.
Factors Contributing to AI Biases
Training Data
Biased historical data used for training can lead to perpetuation of existing inequalities. If the data predominantly consists of loans given to certain demographics, the AI model will inadvertently learn to favor those groups.
Feature Selection
The features or variables used to make decisions can also introduce biases. For instance, if a model relies heavily on zip codes or neighborhoods to assess risk, it might discriminate against individuals from low-income areas.
Sampling Bias
Inadequate or unrepresentative samples can skew results. If a particular group is underrepresented in the training data, the AI model will lack the necessary information to make unbiased decisions about them.
Human Biases
Biases present in the data-collection process by humans, such as loan officers, can be inadvertently transferred to the AI model. This is known as algorithmic bias amplification.
Addressing AI Biases in Banking
As a thought leader and pioneer in decision science, VALID strives for fair and impartial decisioning in detecting deposit risk and other account level decisioning. VALID as a provider of AI and machine learning to top 20 financial institutions has a significant responsibility in addressing these historic biases in the industry. We monitor for any biases and address them using methodologies listed below:
Diverse Teams
Human beings are inherently biased and they pass their biases to the AI models they build. Having a diverse team allows for diverse input and representation. Early AI detection tools developed by homogenous tech communities in Silicon Valley taught us the importance of team diversity. A prime example of such biases and failures was Google photos incorrectly labeling the faces or specific minority groups.
Diverse and Representative Data
Ensuring that training data is diverse, representative, and free from historical biases is paramount. Data augmentation techniques can be employed to increase the diversity of the dataset.
Regular Auditing and Testing
Continuous monitoring and auditing of AI algorithms can help identify biases early on. Rigorous testing against various protected attributes, such as race and gender, is essential. Proxy auditing and having impartial parties on a regular basis audit the features and performance of AI tools, safeguards you from potential bias.
Explainability and Transparency
Developing AI models that can explain their decision-making process helps uncover biases. Transparent models can be scrutinized for fairness and rectified as necessary.
Ethical Frameworks and Regulation
Implementing clear ethical guidelines and regulatory standards for AI within financial services can help curb biases. Regular compliance checks and assessments can ensure that algorithms meet fairness standards.
Data Study
At Valid, we evaluate millions of transactions on a monthly basis for a diverse portfolio of top financial institution clients. One of the decision models we've developed and successfully implemented at six different banks is known as "InstantFUNDS." This particular model is designed to assess the risk of fraud and potential losses at the moment a check is deposited. It operates by determining the likelihood of risk associated with the deposited item and either approves it for immediate availability or flags it for manual review, during which time the transaction is marked as pending for the customer. VALID assumes responsibility for reconciling any losses incurred as a result of items approved for InstantFUNDS.
Valid actively shares the risk with our clients and has a vested interest in minimizing this risk to mitigate potential losses. To ensure equity and fairness, we conducted a comprehensive data study to assess the model's performance across various customer segments, including those from marginalized backgrounds.
Study Design
We organized all accounts affected by this program within our client portfolios and grouped the customers by their respective branch's zip code tied to their account. Utilizing census data, we classified these populations into four groups based on income levels and three groups based on minority representation. The customer population was then divided into thirds, with the below poverty line segment removed from the low-income group. The same procedure was applied to the minority level, dividing the entire population into thirds.
Based on our data, the low-income group represents a household income range of $23,000 to $52,000, the medium-income group represents $52,000 to $75,000, and the high-income group represents $75,000 to $250,000. Any household with an income level of $23,000 or lower is considered below the poverty line. Regarding minority representation, we relied on census data, defining any population other than white as a minority. The entire population is categorized into low, medium, and high minority groups.
Study Implementation
We examined the complete dataset of transactions that our model has processed since its inception. From this dataset, we extracted the Pass Rate SLA (which is defined as all the items passed minus the ineligible items). Additionally, we analyzed the loss rate, which is defined as the rate of approved check deposits that later returned and resulted in a loss for VALID.
Study Results
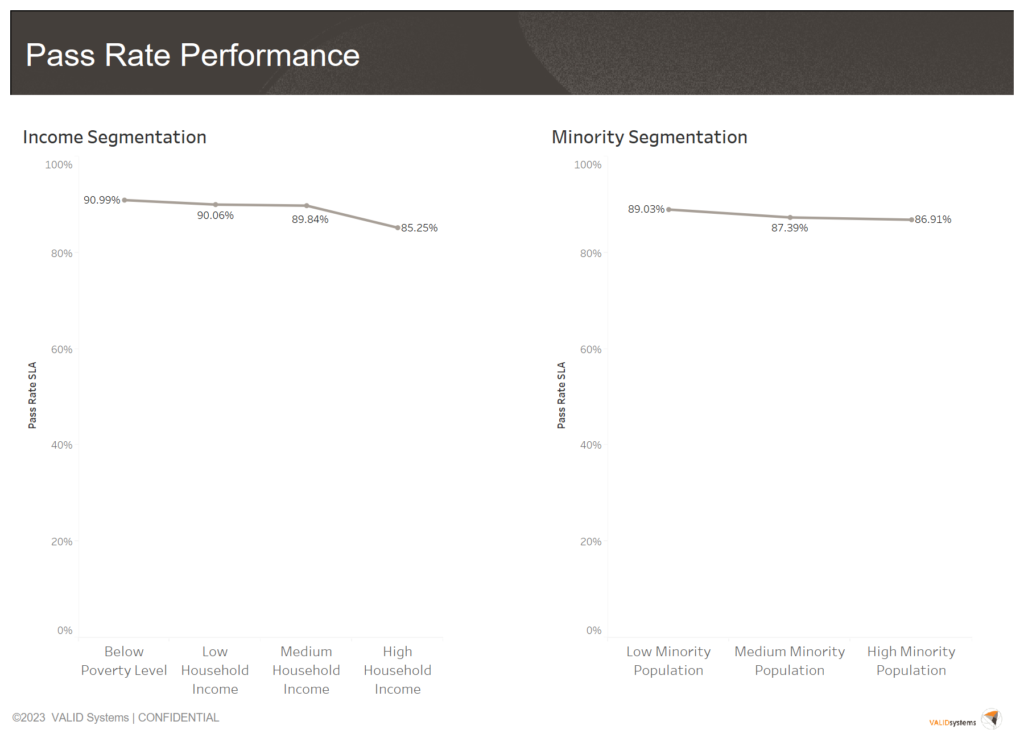
As we meticulously analyzed the data and sought out discernible patterns, we made a noteworthy discovery regarding our Pass Rate SLA across different income and minority groups. We found that these rates remained consistent, and we did not identify any instances of unintentional discriminatory treatment by our AI model.
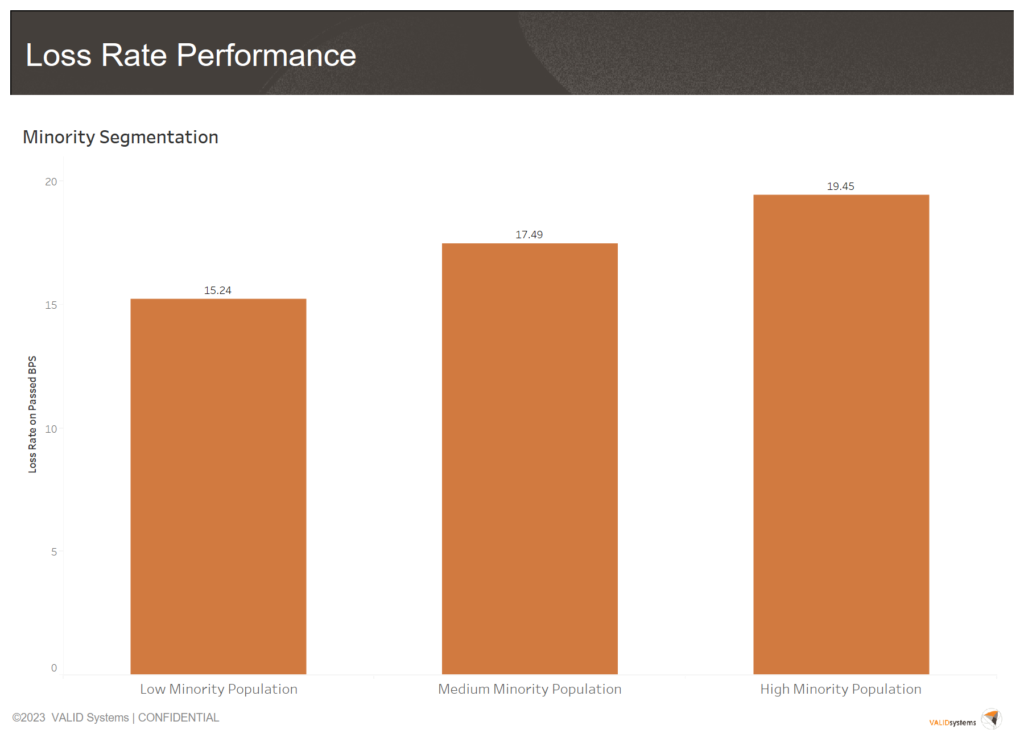
However, a particularly intriguing revelation emerged when we examined our loss rate in relation to minority and income levels. The data clearly indicated that we experience a higher loss rate and, consequently, greater financial losses among the high minority groups. This is indeed positive news when it comes to the fairness audit of our model. It suggests that, if we were biased, we would optimize our model to reject more transactions within lower-income and high minority groups. The absence of such bias underscores our dedication to effective feature design and ongoing performance monitoring of our AI models.
Please find below the exhibits summarizing our findings.
Pass Rate SLA Comparison Across Minority and Income Segments
Breakdown of Customer Minority Segmentation Based on Zip Code
| Minority Segment | Sum Population Zip Code | Minimum Percent Minority Population | Maximum Percent Minority Population |
| Low Minority Pop | 1,873,434,834 | 0.0000% | 10.9656% |
| Medium Minority Pop | 1,873,135,062 | 10.9657% | 29.0080% |
| High Minority Pop | 1,874,044,152 | 29.0113% | 100.0000% |
Breakdown of Customer Income Segmentation Based on Zip Code
| Household Income Segment | Sum Population Zip Code | Minimum Income Per Household | Maximum Income Per Household |
| Low Household Income: Below Poverty Level | 77,288,940 | $0 | $23,019 |
| Low Household Income | 1,794,070,782 | $23,051 | $53,696 |
| Medium Household Income | 1,856,673,036 | $53,697 | $75,000 |
| High Household Income | 1,892,581,290 | $75,015 | $250,000 |
VALID’s Performance Results Across Minority Segments
| Items Eligible | Items Passed | Pass Rate SLA | Loss Rate | Loss Rate on Failed | Loss Rate on Passed | |
| High Minority Pop | 38,810,351 | 31,007,963 | 86.91% | 1.32% | 2.07% | 0.19% |
| Medium Minority Pop | 60,084,887 | 48,968,964 | 87.39% | 0.85% | 1.25% | 0.17% |
| Low Minority Pop | 64,552,252 | 54,272,428 | 89.03% | 0.64% | 0.95% | 0.15% |
VALID’s Performance Results Across Income Segments
| Items Eligible | Items Passed | Pass Rate SLA | Loss Rate | Loss Rate on Failed | Loss Rate on Passed | |
| Low Household Income: Below Poverty Level | 1,185,192 | 988,310 | 90.99% | 0.79% | 1.47% | 0.15% |
| Low Household Income | 39,541,406 | 33,194,499 | 90.06% | 1.03% | 1.80% | 0.17% |
| Medium Household Income | 52,387,635 | 44,161,012 | 89.84% | 0.81% | 1.32% | 0.16% |
| High Household Income | 70,333,257 | 55,905,534 | 85.25% | 0.85% | 1.17% | 0.18% |
Conclusion
While AI technologies hold immense promise for revolutionizing the banking and financial sectors, they also come with inherent risks, including biases that can perpetuate societal inequalities. It is crucial for the industry to proactively address and rectify these biases to ensure that AI is a force for positive change rather than an amplifier of historical injustices. By fostering a culture of transparency, accountability, and ethical AI development, the banking industry can pave the way for a more equitable and just financial landscape. At VALID we take this responsibility seriously and work tirelessly to engineer fairness.
Glossary
- Pass Rate - Rate of passing presented items for immediate funds
- Pass Rate SLA - Rate of all items passed minus the ineligible items
- Eligibility – a series of criteria making an item presented eligible for immediate funds (ex: business vs. Consumer account)
- Loss Rate - Rate of model exposure resulting in loss for Valid
Sources
Let us guide you through!
Talk to an expert
